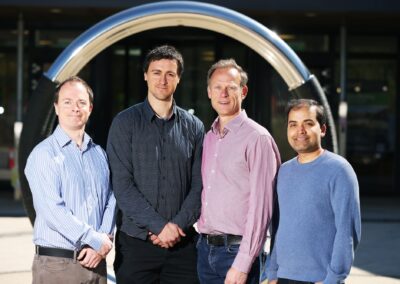
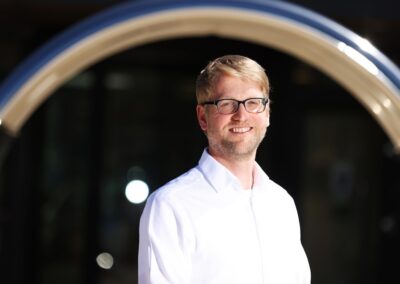
Steve Whitla is passionate about maps. He is the founder and CEO of Visual Meaning, a company that helps large organisations make sense of how they work using conceptual maps. His team are experts in visualising complex systems to make them more accessible and easy-to-understand. Steve describes their work “as creating a kind of road map of how an organisation or process works”.
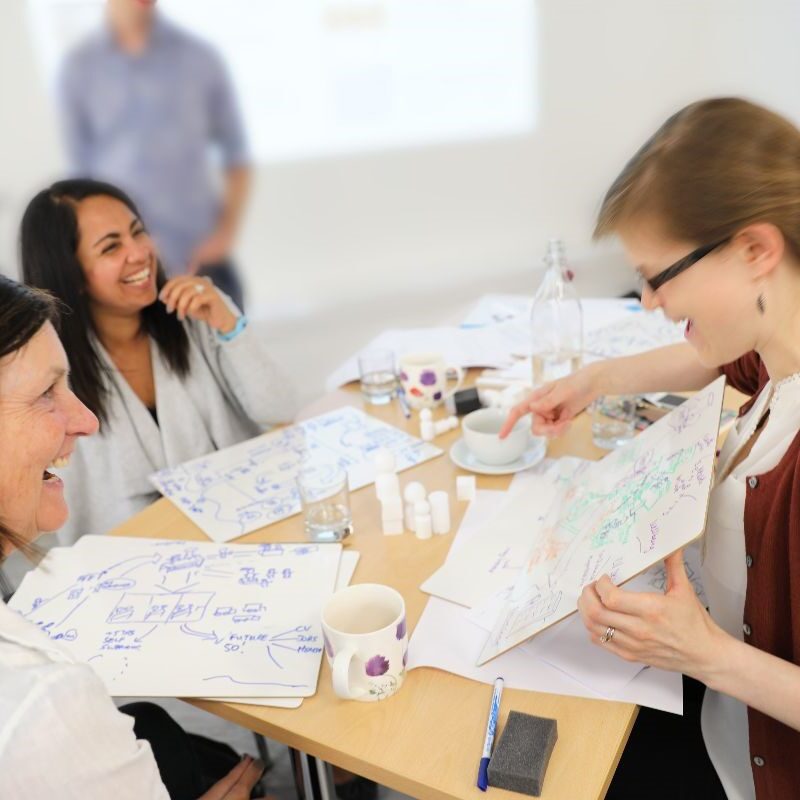
Typically, most organisations use impenetrable Powerpoint presentations with lots of boxes and arrows to explain quite complex ideas or systems. Visual Meaning is often parachuted in to demystify these systems by creating visual maps, videos and animations that explain operating models, programme structures, sets of processes or even sectors of the economy in a way everyone can understand. To make it easy, they’ve produced a visual map so you can see how they work.
Visual Meaning usually works with organisations undergoing change, where complexity is often a big issue. Steve and his team have worked with a lot of large, blue chip organisations including Network Rail, BT, Unilever, GSK, RBS, the Foreign and Commonwealth Office and the Ministry of Defence. He feels that their visual maps “give shared meaning and help to democratise knowledge within an organisation”. He says: “Communication is at the heart of transformation and visual maps can help de-risk the process and accelerate the change”.
Visual meaning.
With artistic parents, Steve’s initial degree was in music but he went on to study management at Cambridge. He then worked for several consultancies before heading up the creative media team at KPMG Consulting. Fifteen years ago, he was asked for a visualisation of a strategy – and with his artistic background and consultancy skills – he realised that he’d found his niche. Visualising ideas and concepts became very popular with clients and his workload grew. After three years, he set up his own agency – Delta 7 – with colleague Julian Burton, and then went on to found Visual Meaning to focus solely on visual maps.
Steve has big ideas. He thinks that system maps could revolutionise our ability to understand and change the world. He says: “I’d like to map society to create a more meaningful world. We can’t solve systemic problems from one perspective, and maps give us a shared frame of reference to give context, resulting in more meaningful conversations about the world we live in”. You can watch his TEDxOxford talk on the matter here.
Visual Meaning continues to grow; Steve says their biggest challenge for 2018 will be “to integrate live data into their maps to increase their value and make them into a day-to-day operational resource”.
“Each organisation will have different systems and the integration needs to be standardised to ensure it is affordable. That’s the challenge!”
He enjoys being in Oxford and finds Oxford Centre for Innovation, (OCFI) a good base with its regular meet-ups. Maybe he’ll map all the innovative companies at the Centre soon…… Let’s see….
For more information on Visual Meaning, click here.